

Home > Experiments > The demise of the Pony Express
Demise of the Pony Express: idea feasibility testing
September 2006
In the response to the Gold Rush in the mid-1800s, the Pony Express was developed as an alternative mail service crossing the North American continent. Using mounted riders, the founders of the Pony Express hoped to create a conduit for mail that was faster and more reliable than stagecoaches. |
 |
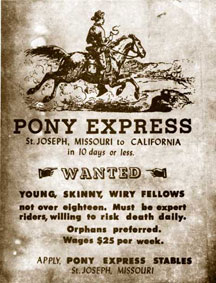 |
The demise of the Pony Express is commonly attributed to the telegraph. The completion of the telegraph network and the termination of the Express occurred within a one-month period. |
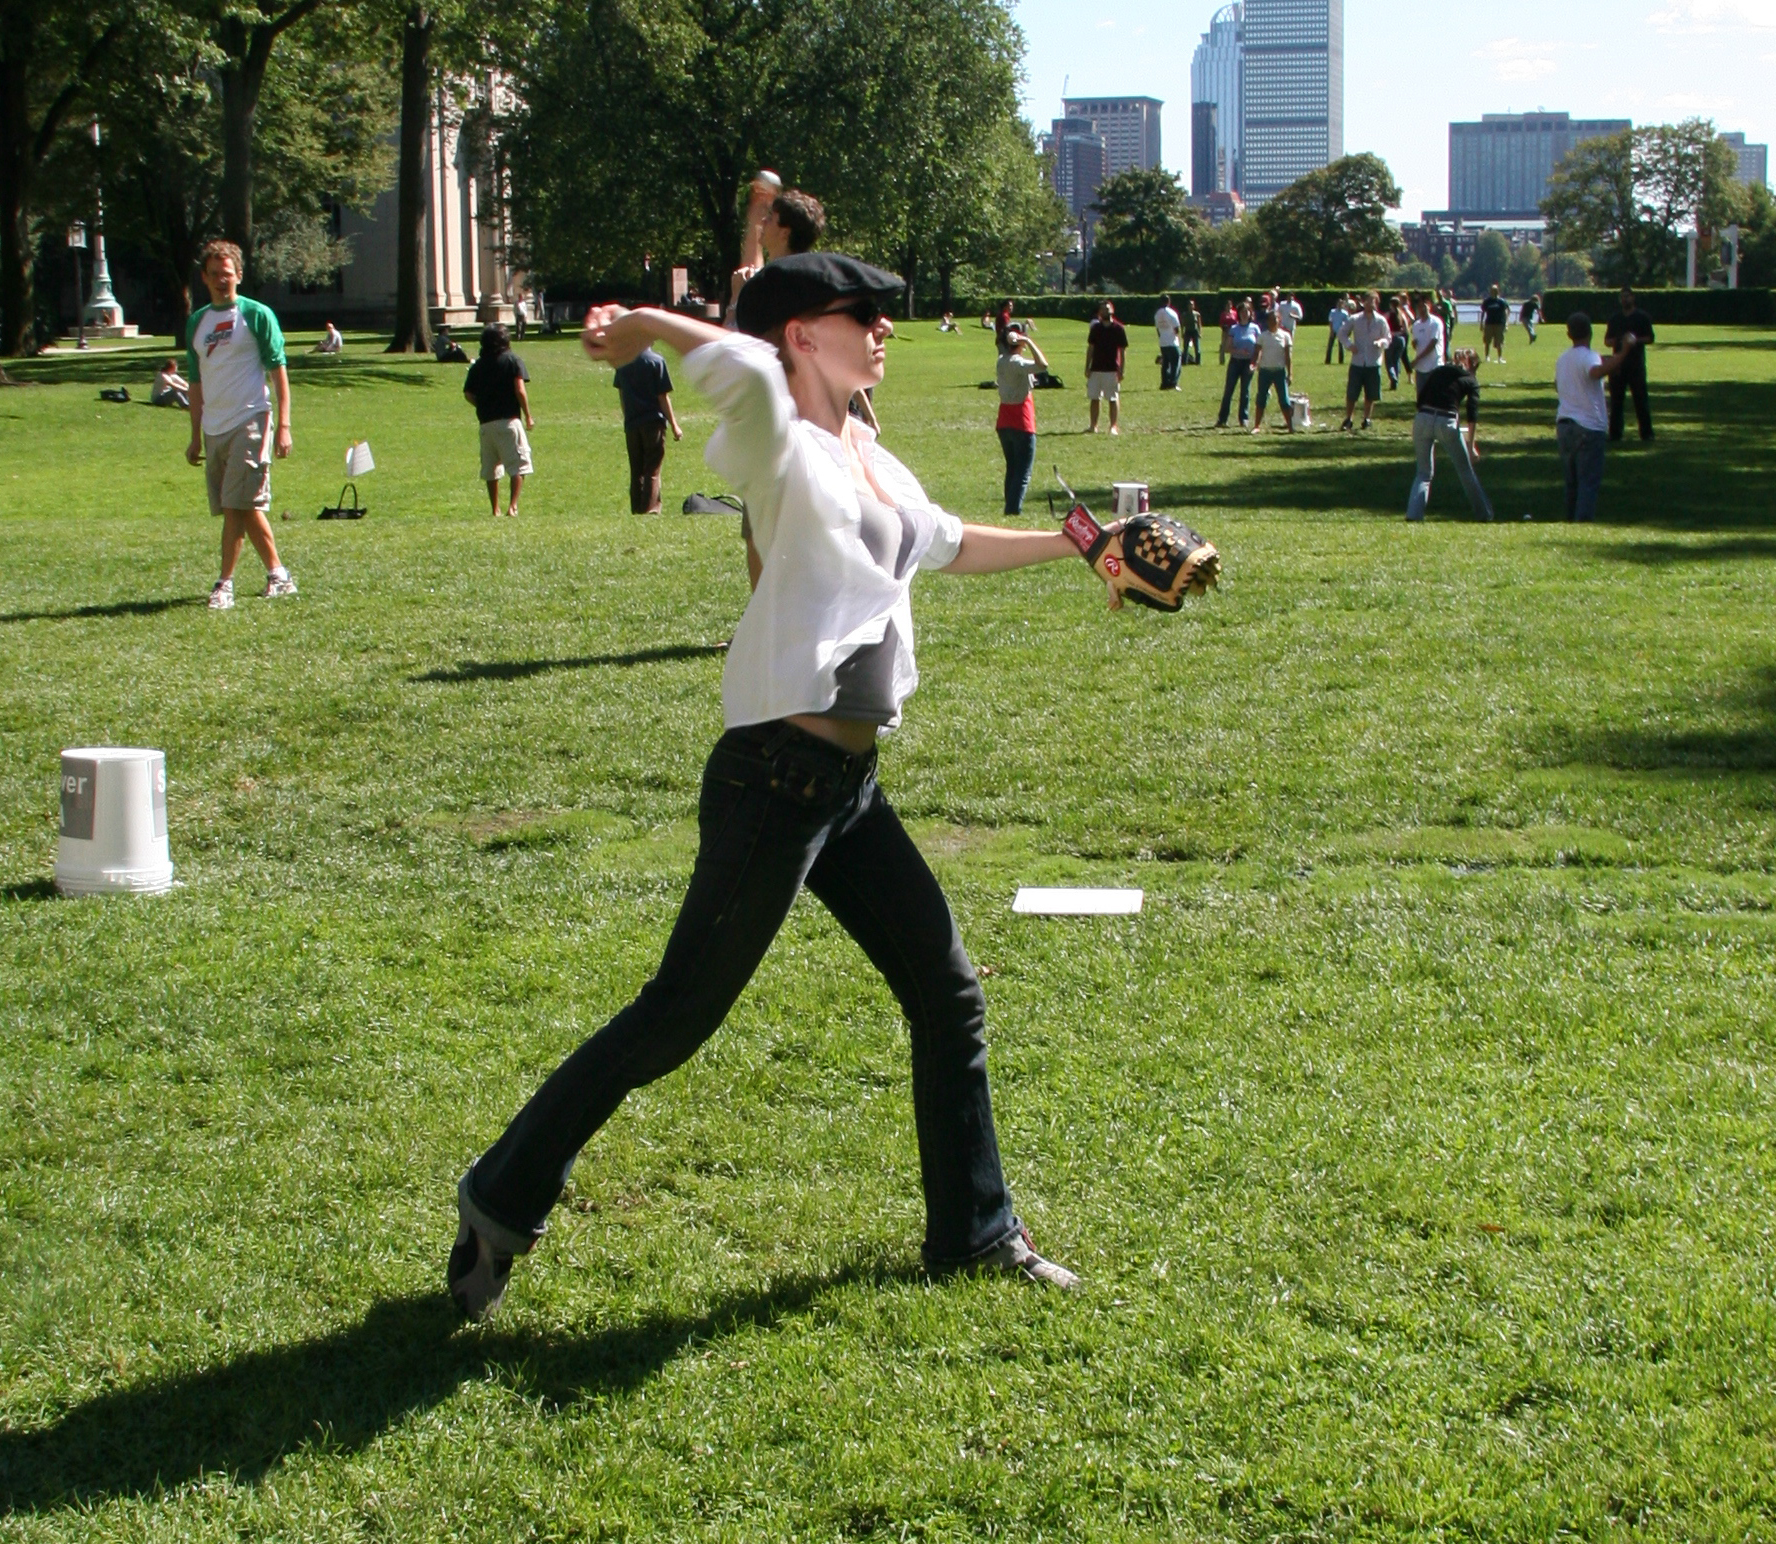
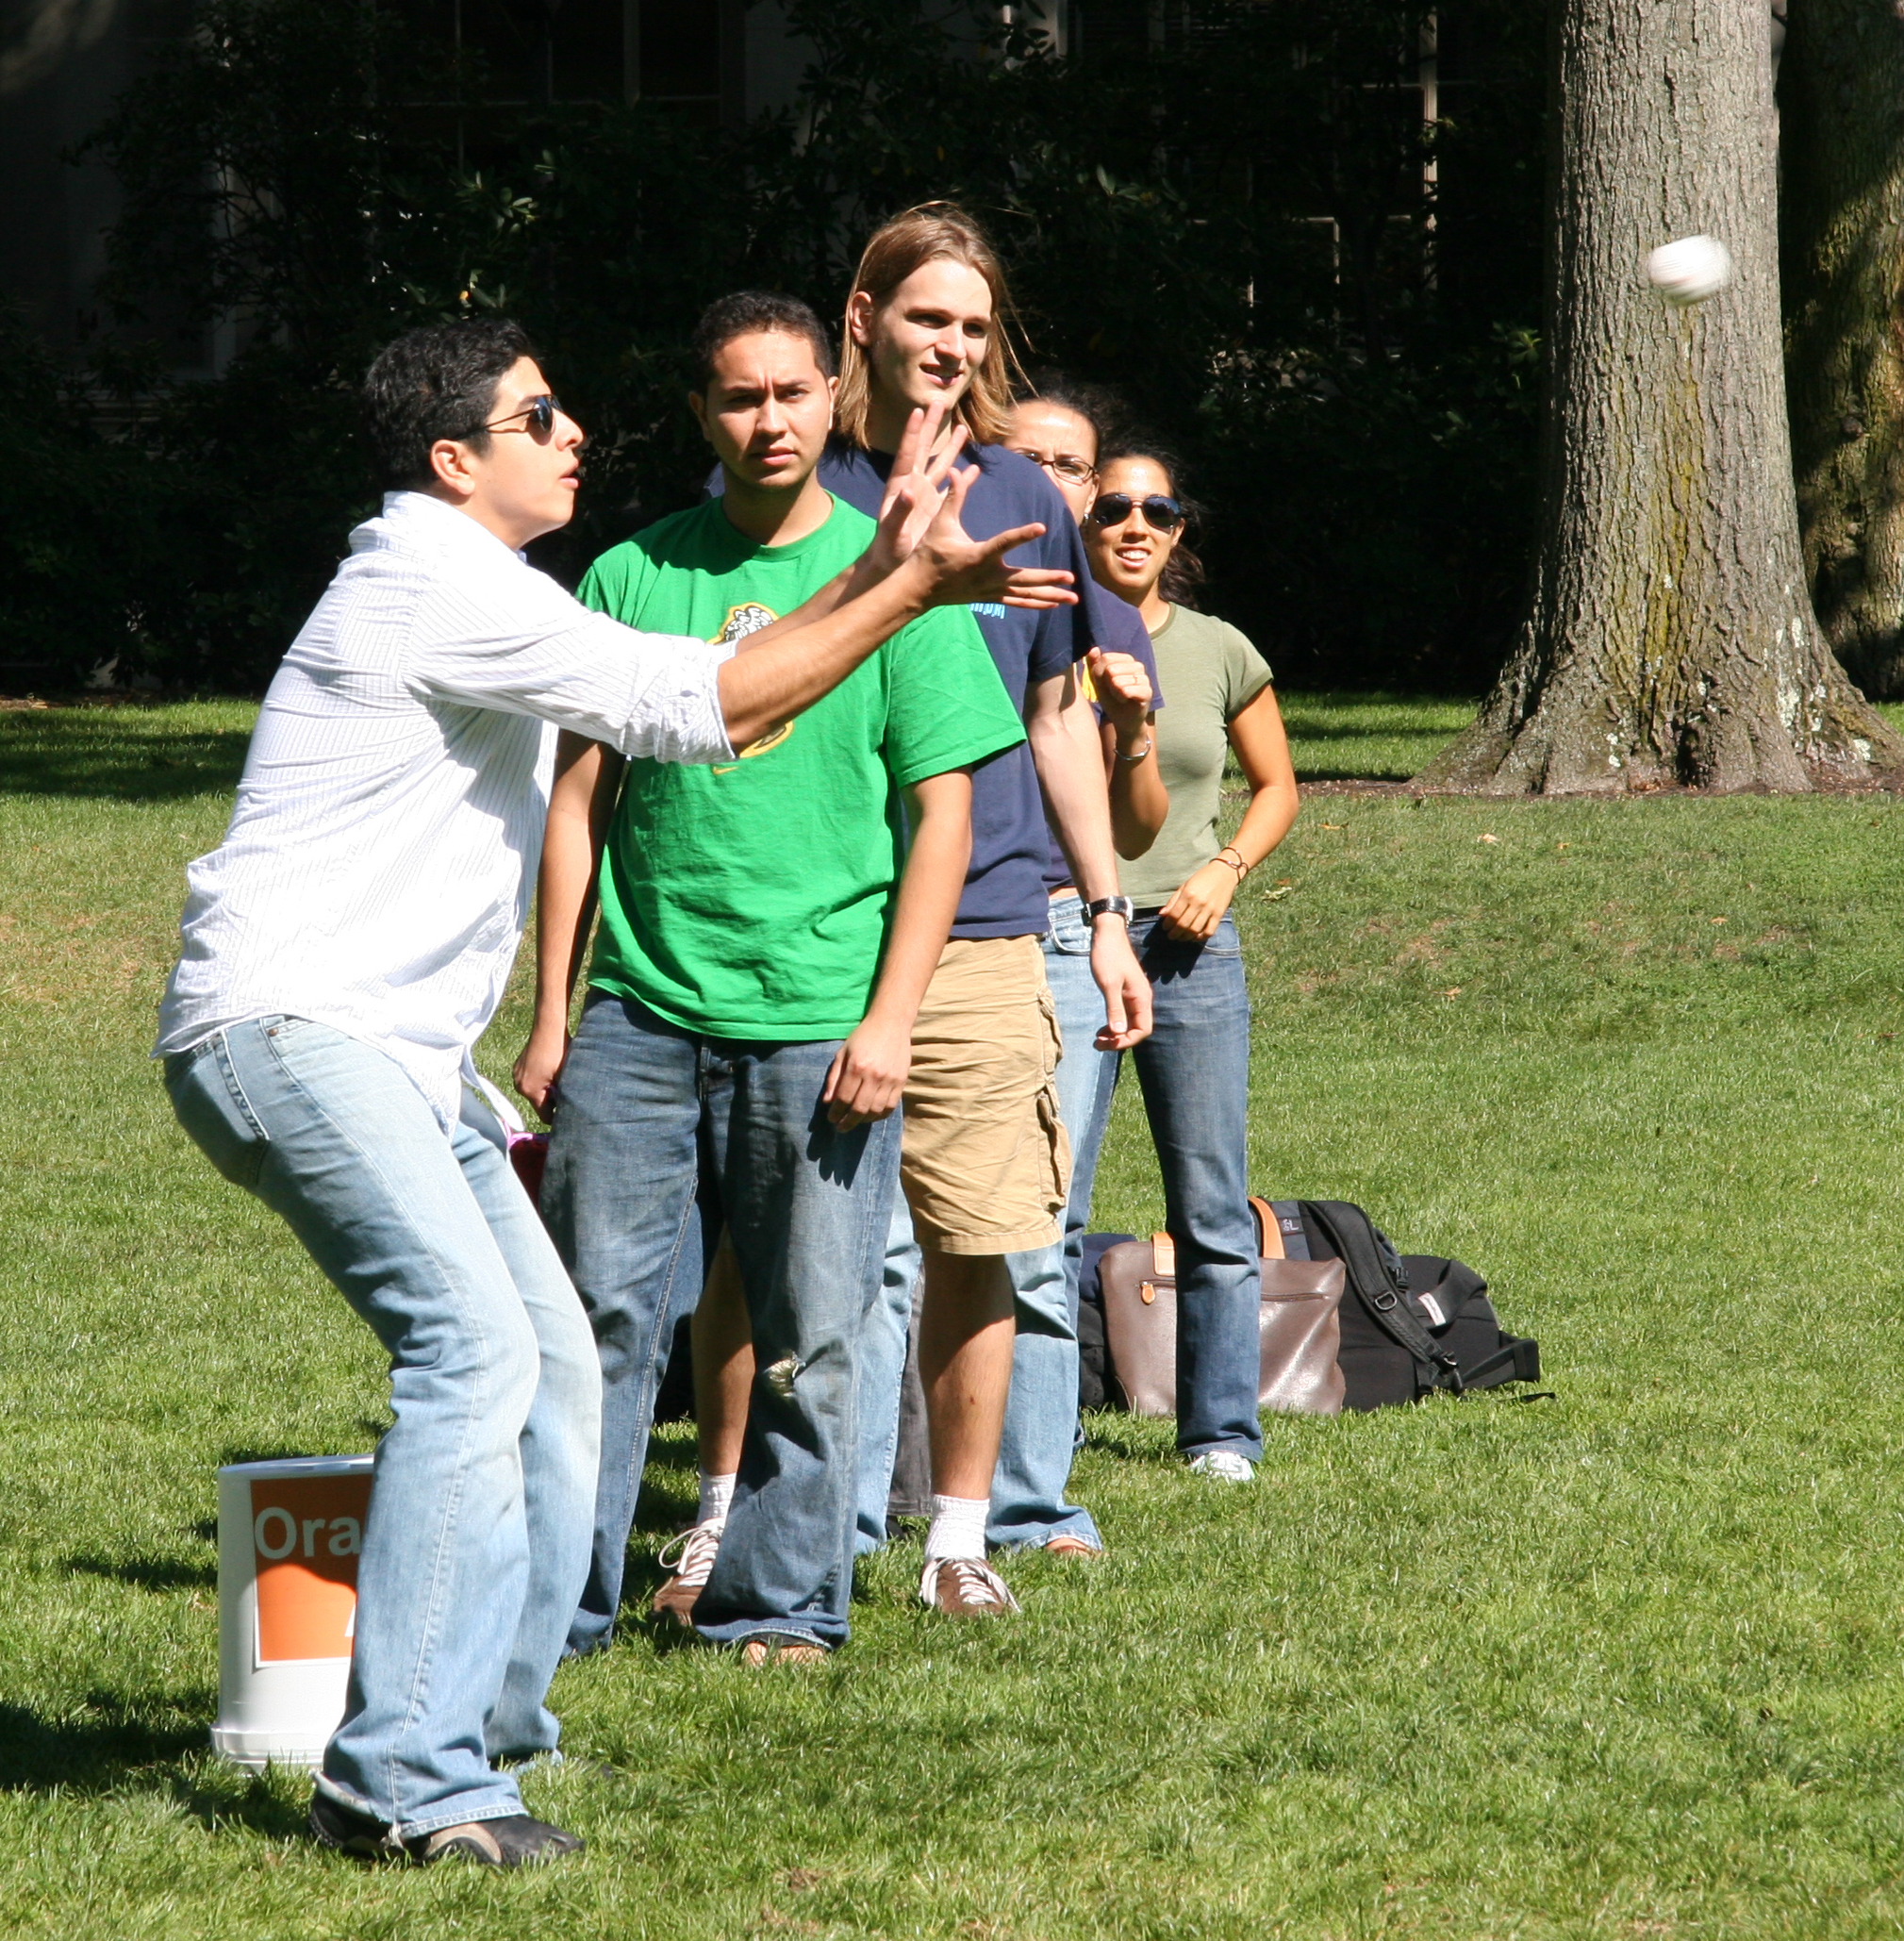
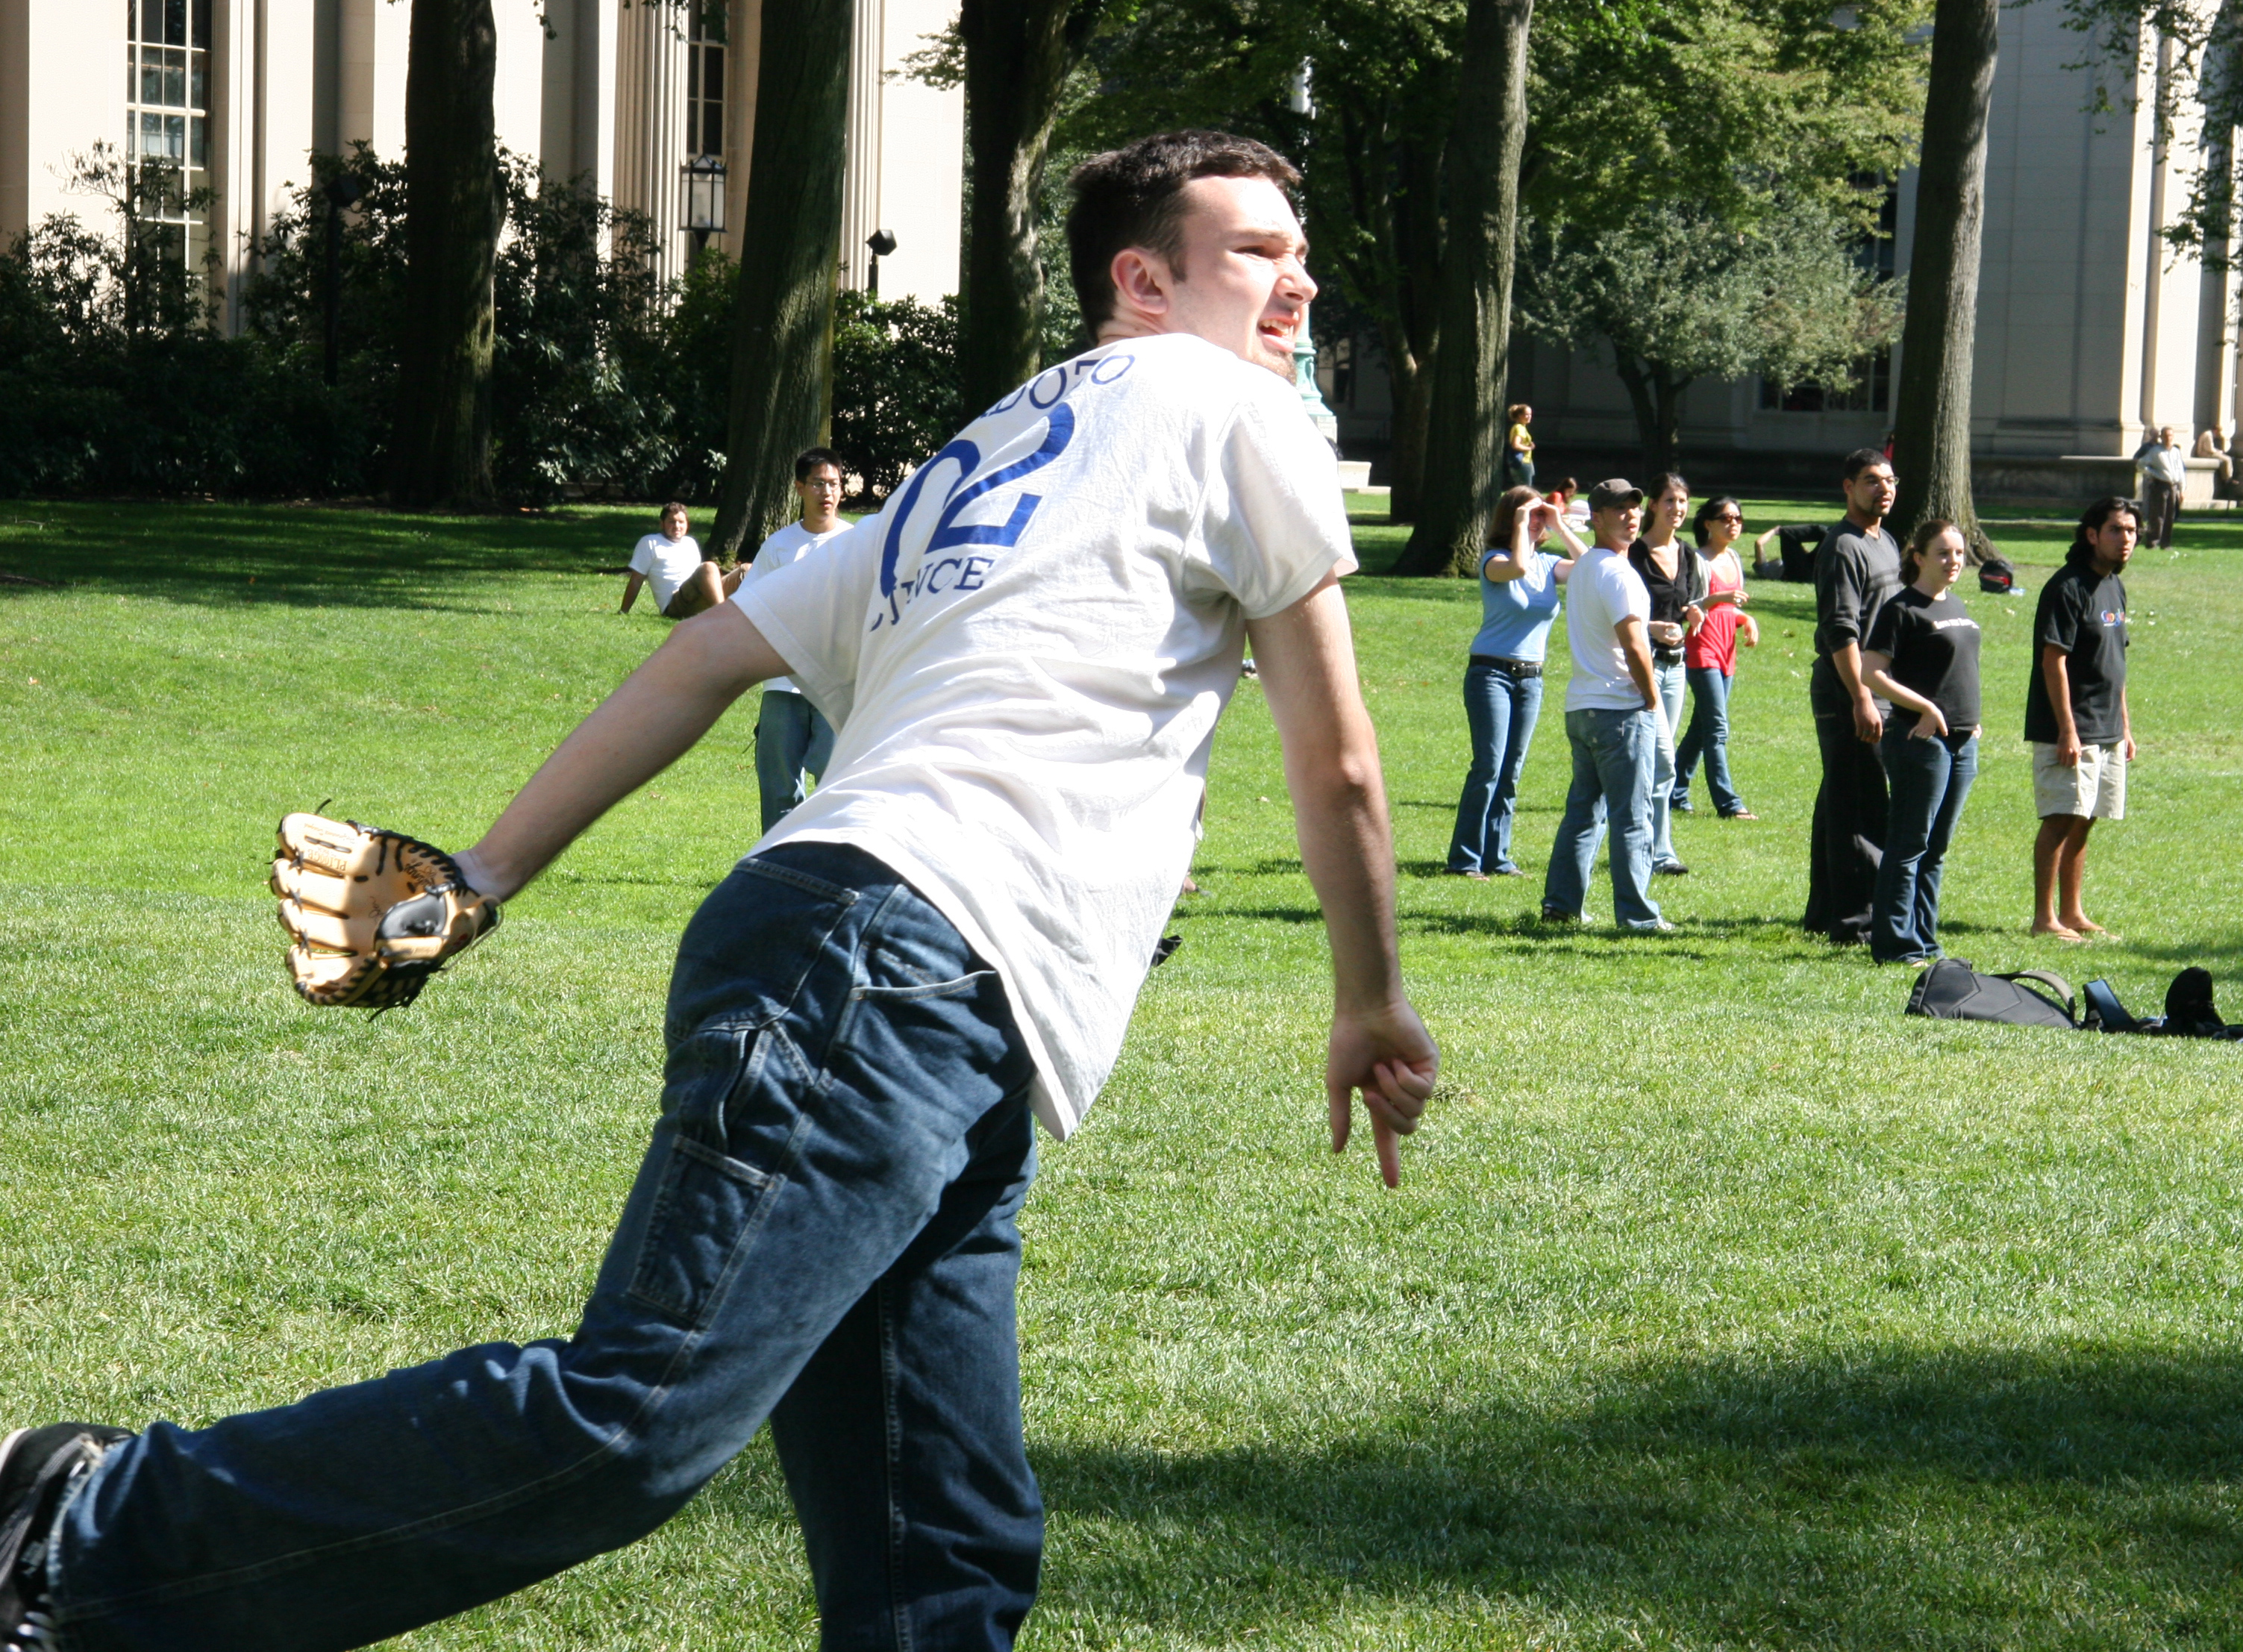
Letters were placed inside baseballs and thrown along a relay of ball carriers. This new system was faster than using horses, and the ball carriers were less tired than the Pony Express riders, who had to endure long days in the saddle. All a ball carrier had to do was hang out and play catch. |
 |
 |
|
Here is how the course instructor approached the problem. Assuming an average ball carrier can throw a 40 mph ball 100 feet and catch-throw in 2 seconds, the ball relay is expected to be a blazing 20 mph, roughly 2X the Express’s average speed of 10 mph. However, just one drop in 10 might allow the express to win. |
|

|
A confirmation sketch model, or validation experiment, was in order. |

Resolving the debate Watch the video to see the action and then read on for more details.
|
Don't see the video? |
 |
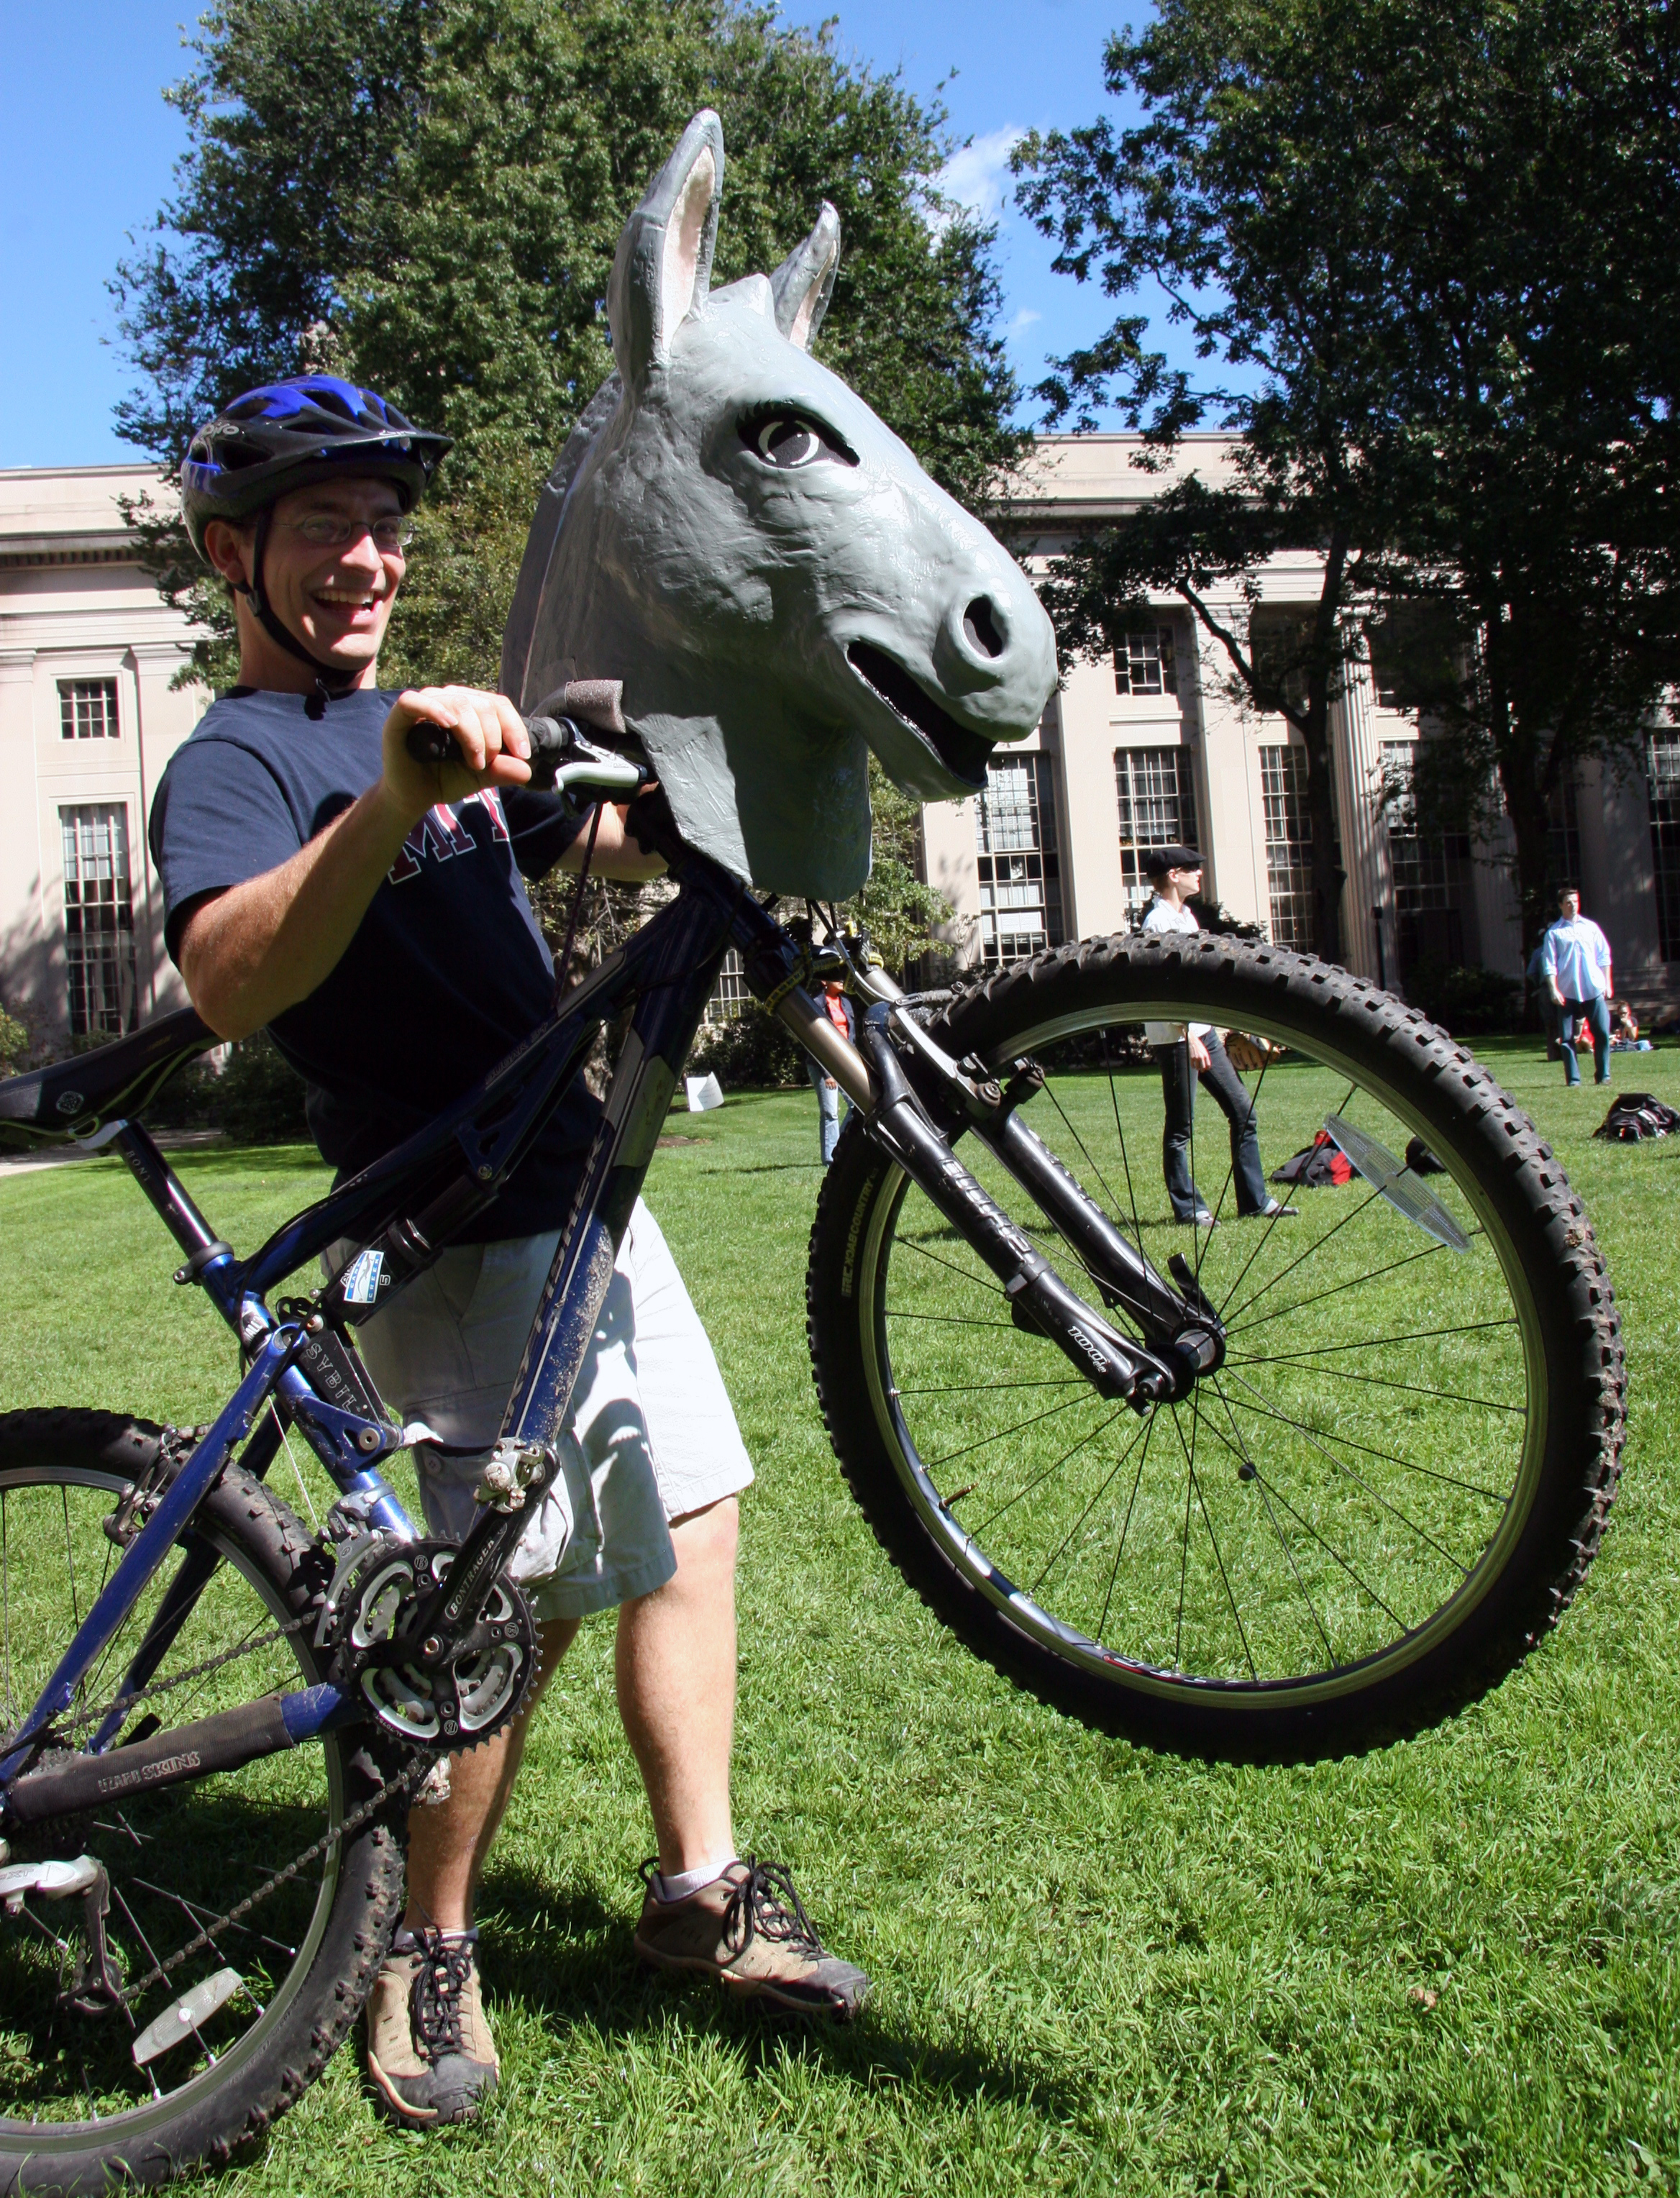
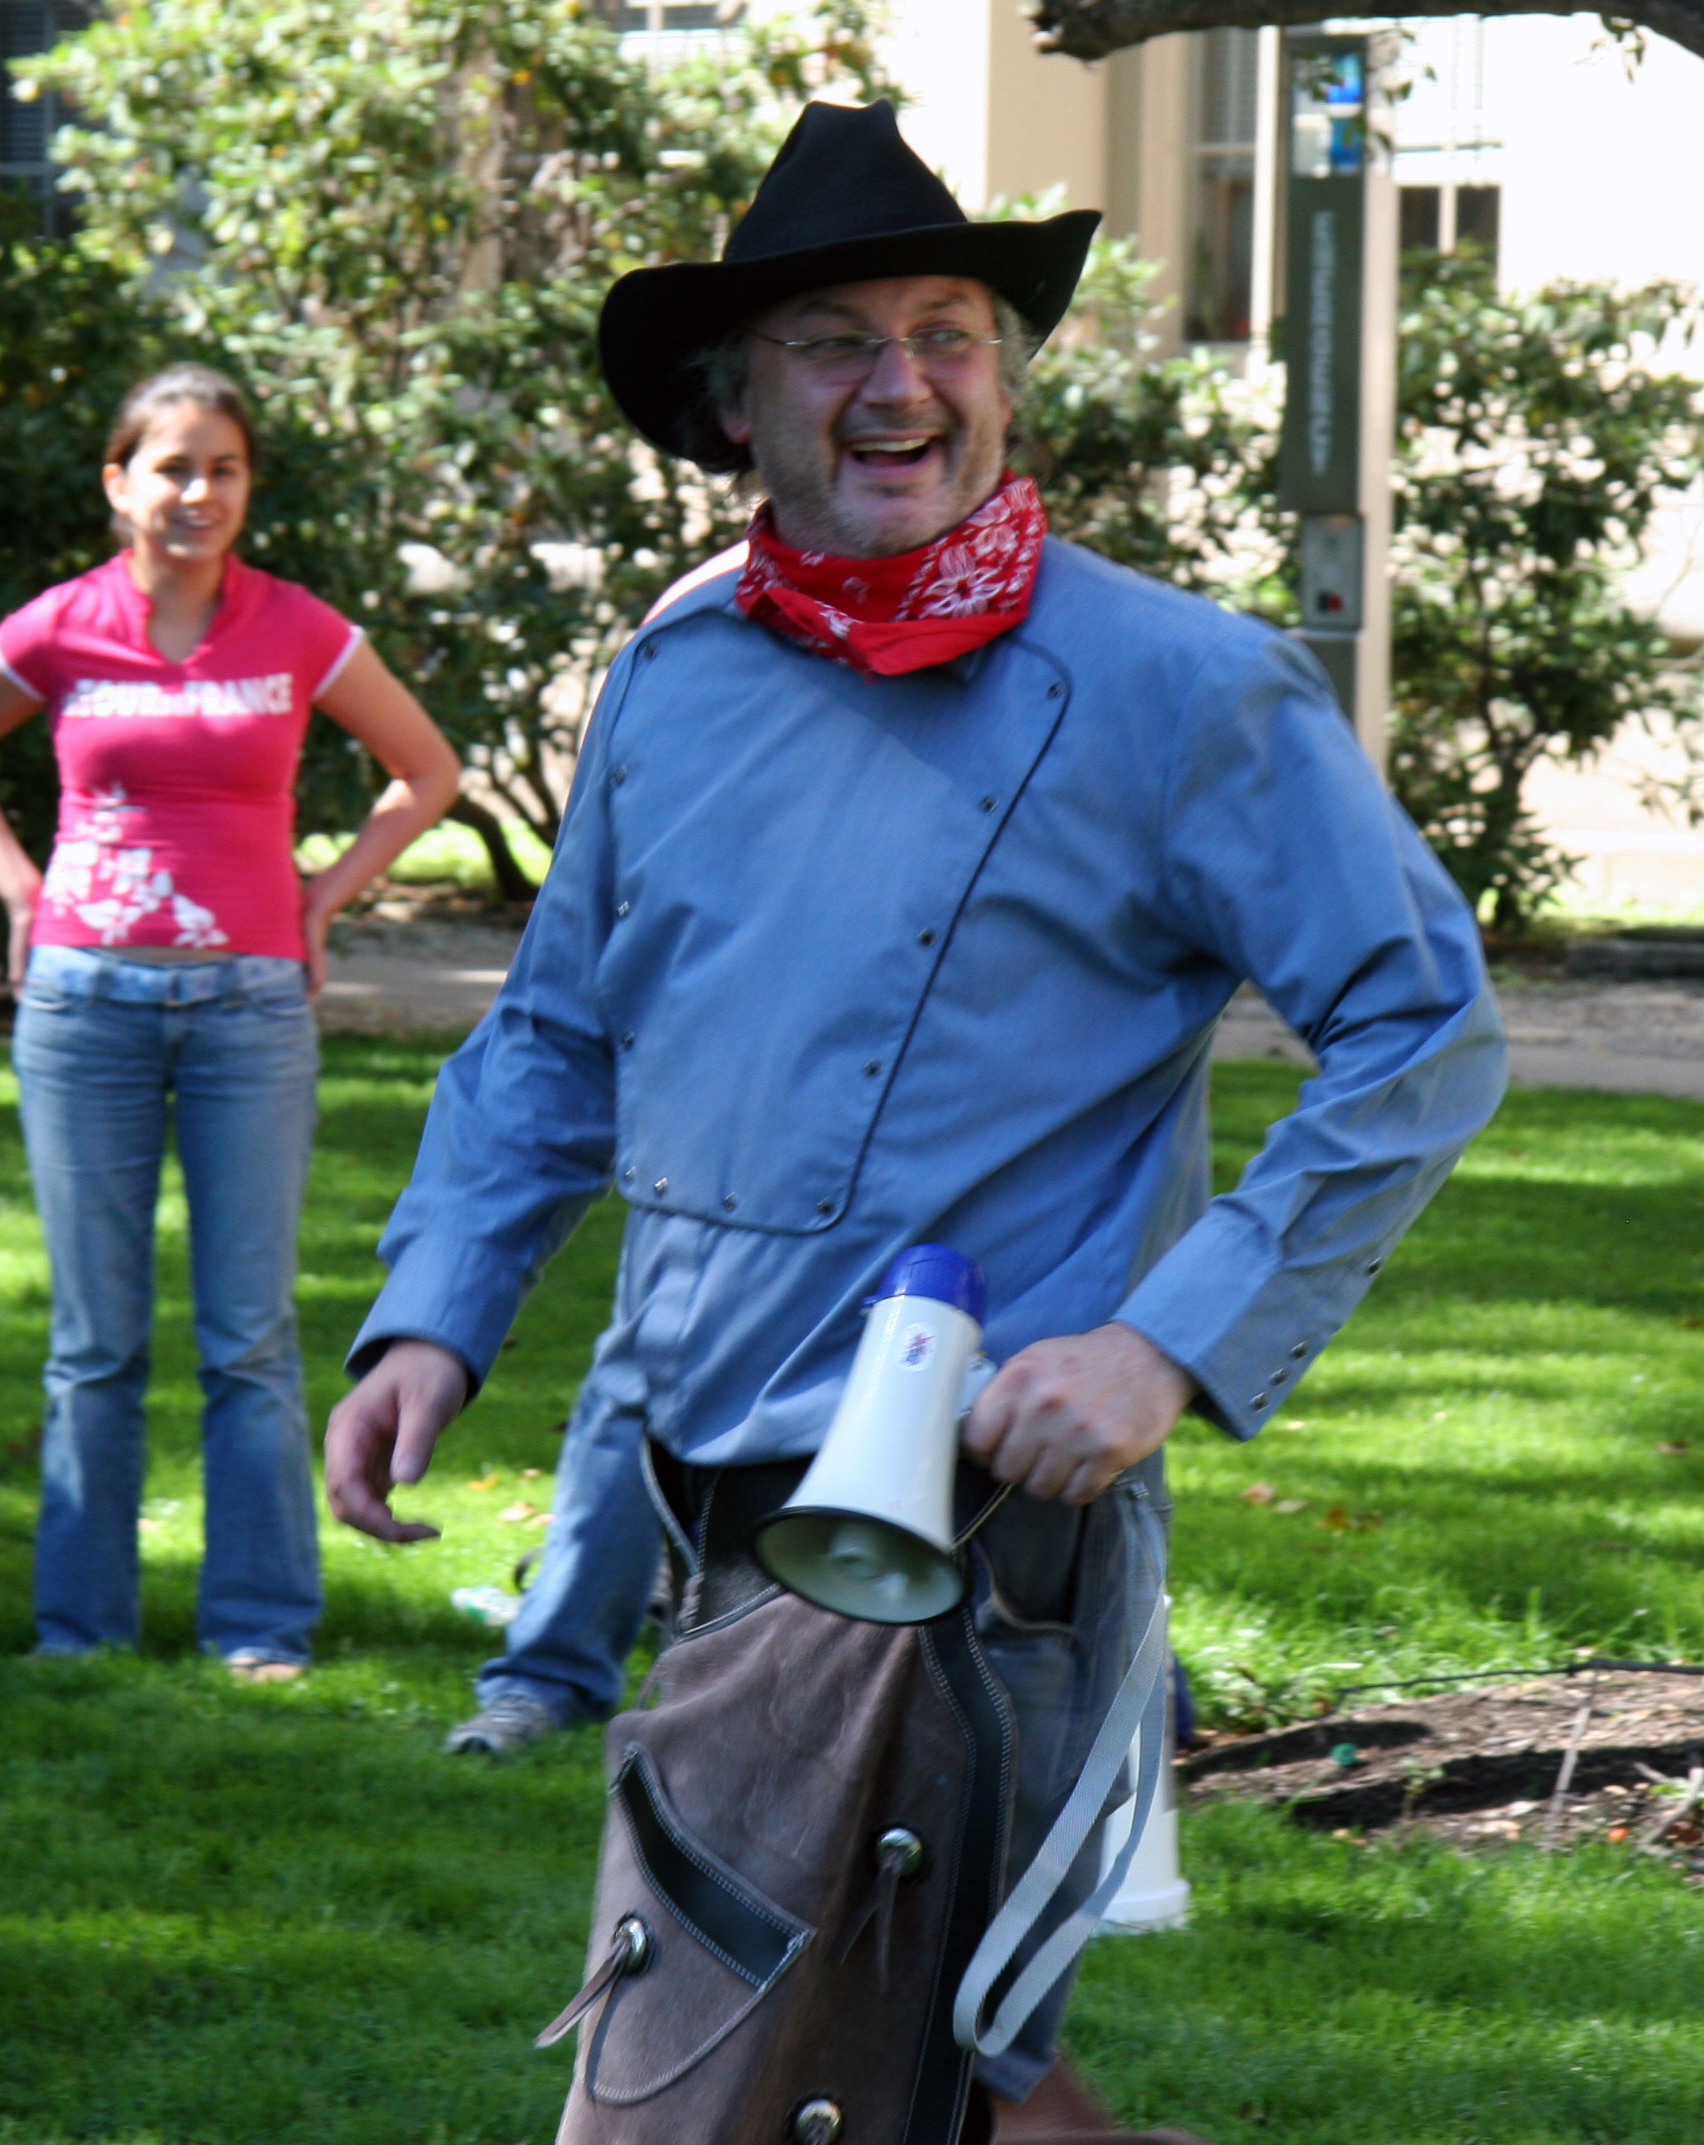
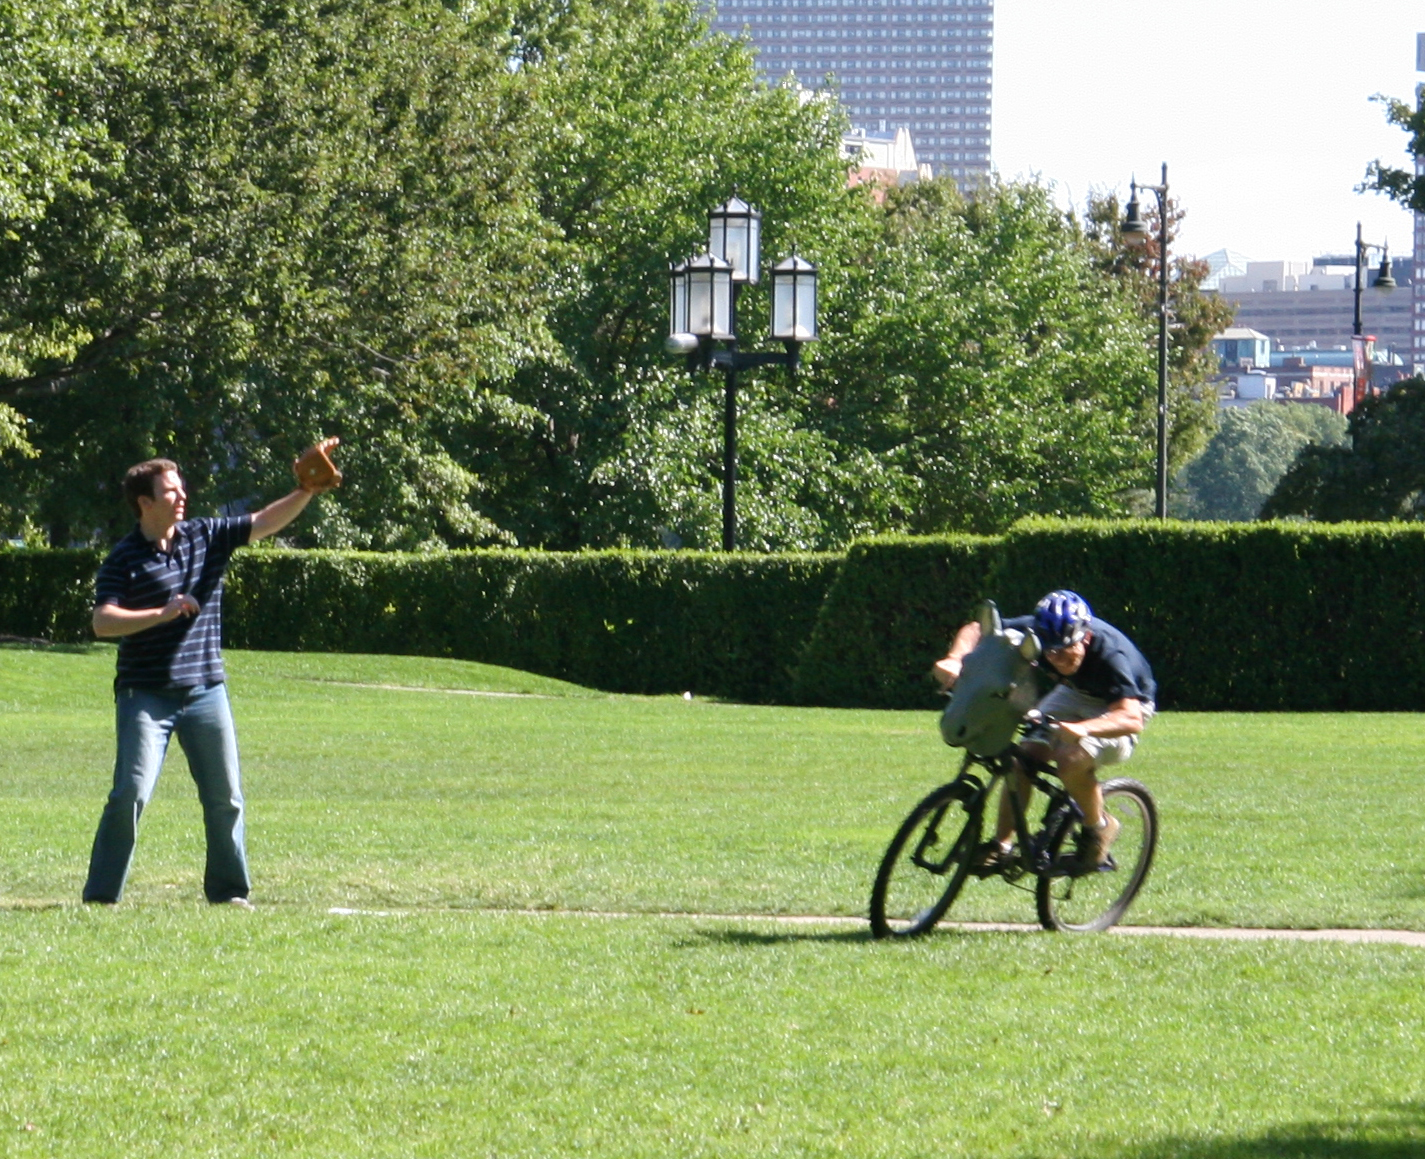
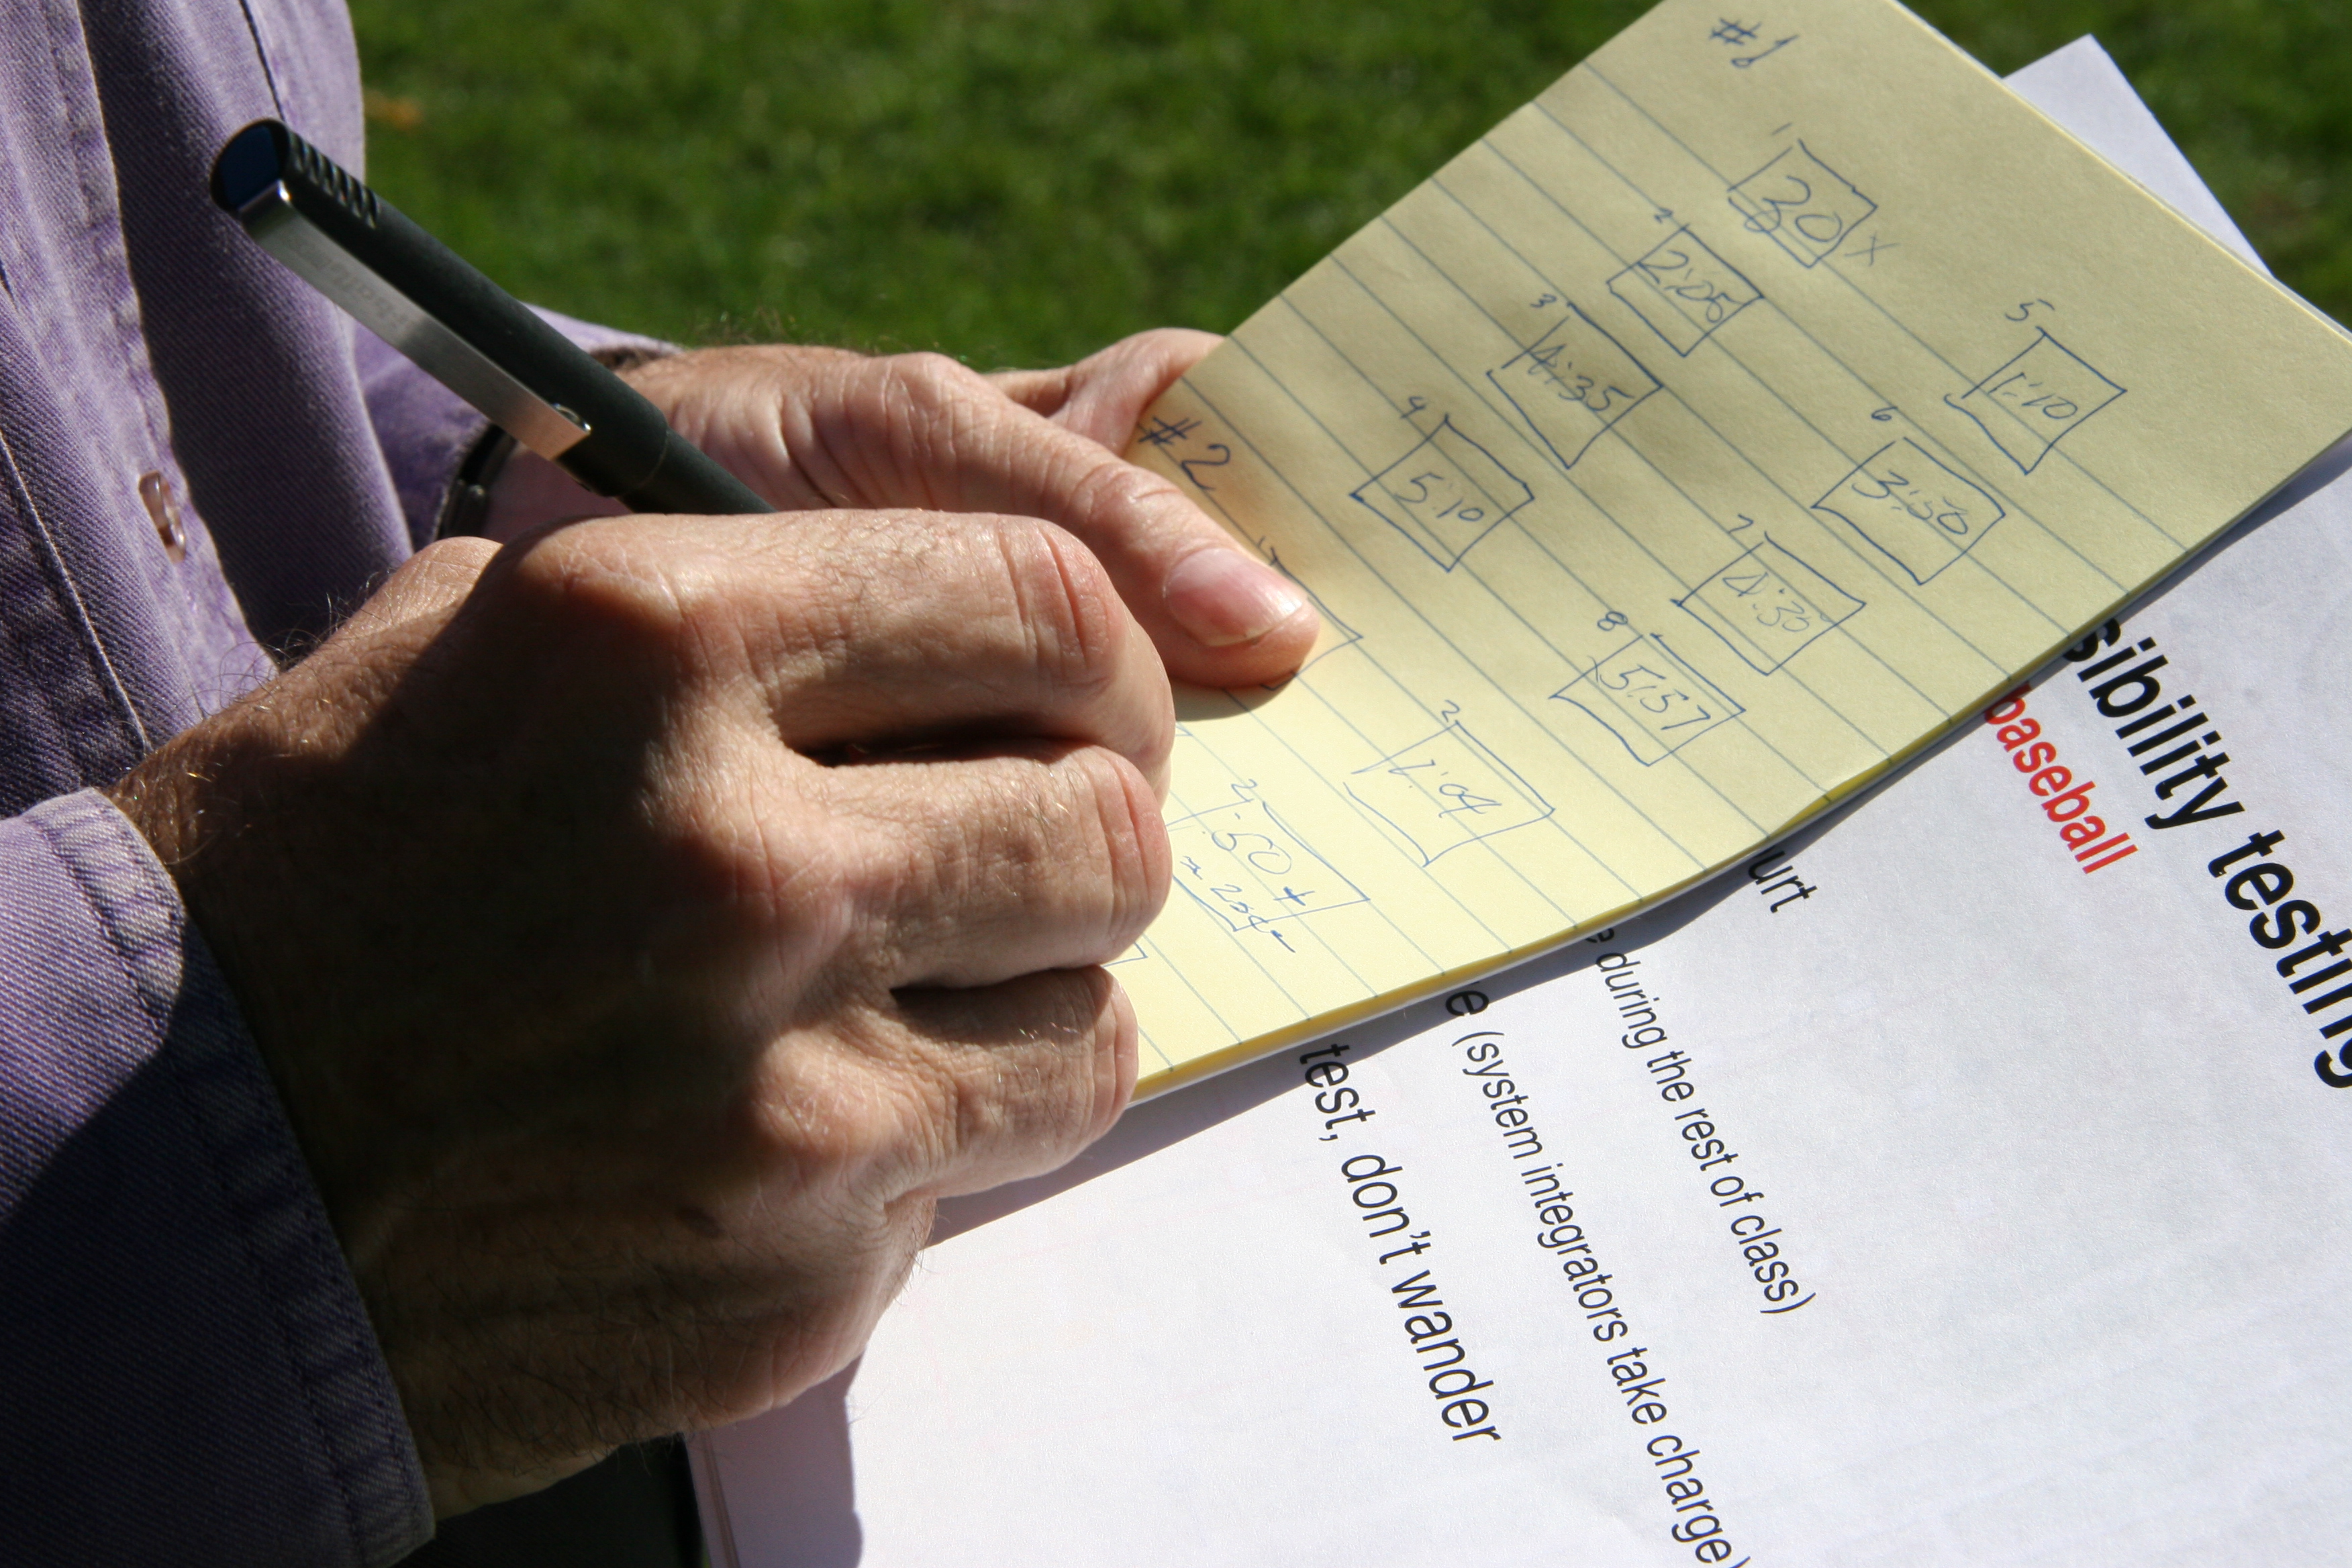
After a 10-minute warm-up and practice session, the validation experiment was completed under the watchful eye of an impartial cowboy. The GPS-equipped Pony Express rider was Tom, the teaching assistant, on his horse-headed mountain bike. |
|
|
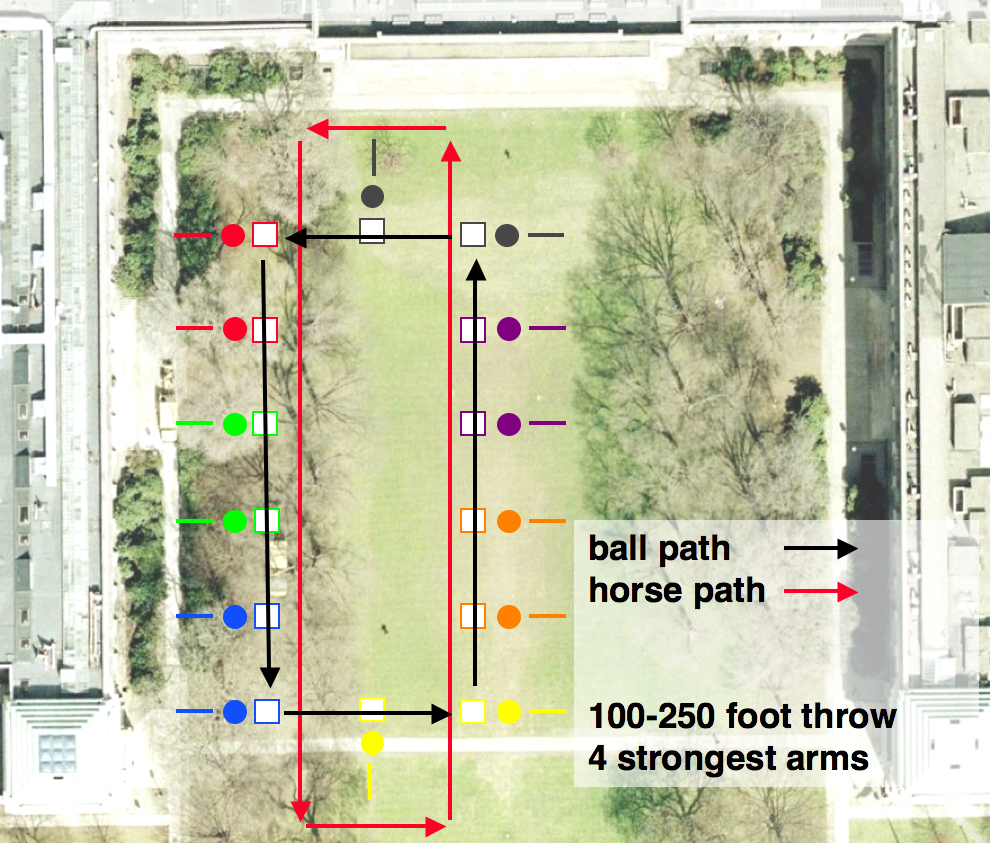
50 feet, what we determined to be a manageable throwing distance for the average, non-athletic MIT arm, separated each station. |
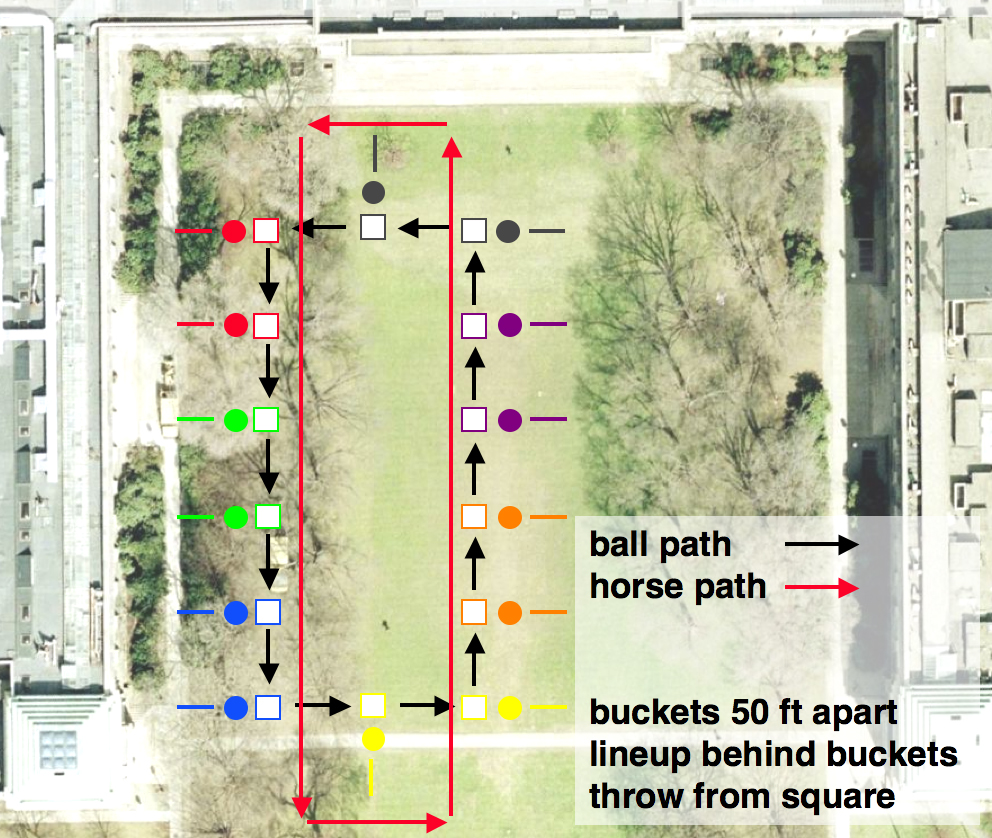
The rider reined his horse at the Express’s average speed of 10 mph. |
 |
 |
 |
The Express rider maintained a speedy 15 mph. Over-throws and missed catches led to a dramatic finish — with the ball just overtaking the Express rider as he crossed the finish line. |
 |
 |
|
The third challenge matched the 100-foot throwing distance assumed in the estimation calculations. Seven strong throwers threw to every second station and the rider rode his horse as fast as possible, competing over 2 loops around the courtyard. |

The winded horse struggled to keep pace. |
 |
 |
 |
|
Under the 100 ft throw conditions assumed in the back-of-the-envelope estimate, the predictions were born-out in reality. |
 |
 |
We estimated a relay speed of 20 mph and achieved an actual speed of 18.5 mph—an unexpected result given the ball drop rate was 40%. The average drop recovery was under 2 seconds, 10 times less than allowed for in the estimation.
Our conclusion: myth technically feasible! |
|